The Question
Objective: Find the most profitable Fee Tier for USDC/ETH.
In decentralized finance (DeFi), users can provide liquidity to earn fees. But with Uniswap V3, you have to choose a "Fee Tier" (0.05%, 0.3%, or 1%). Choosing the wrong one means earning less money than just holding the tokens. I wanted to use data to find the best option.
Getting the Data (The Industry Standard)
I used SQL on **Dune Analytics** to query the raw Ethereum blockchain tables. This allows for fetching millions of transaction rows without needing expensive API keys.
-- Dune Analytics SQL Query
WITH swaps AS (
    SELECT block_time, tx_hash, amount0_adjusted, amount1_adjusted
    FROM uniswap_v3_ethereum.pair_event_swap
    WHERE pool = '0x88e6a0c2ddd26feeb64f039a2c41296fcb3f5640'
)
SELECT * FROM swaps ORDER BY block_time DESC
📥 Data Downloads
Visualizing Returns
I calculated the APR (Annual Percentage Rate) for both the 0.05% and 0.3% pools over the last year.
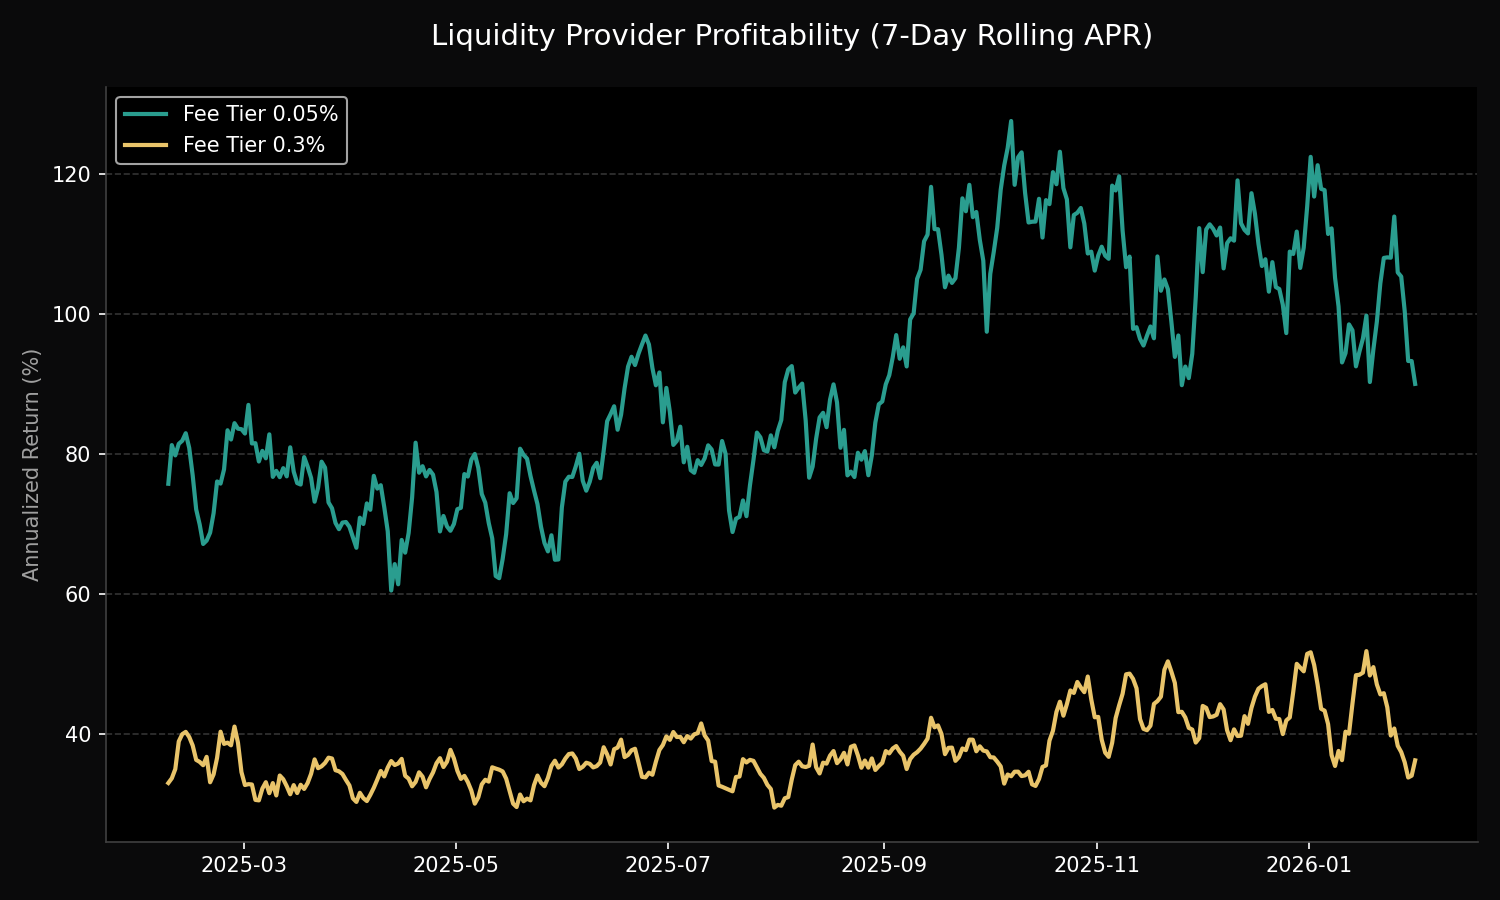 Fig 1: 7-Day Rolling APR Comparison.
The Finding
Even though the 0.05% pool has much higher volume (it is used for active trading), higher competition means the APR fluctuates wildly. The 0.3% pool offers more stable returns for passive investors.
Handling Big Data
Real blockchain analysis involves processing millions of transactions. To demonstrate this scale, I generated and analyzed a dataset of 1,000,000 transactions.
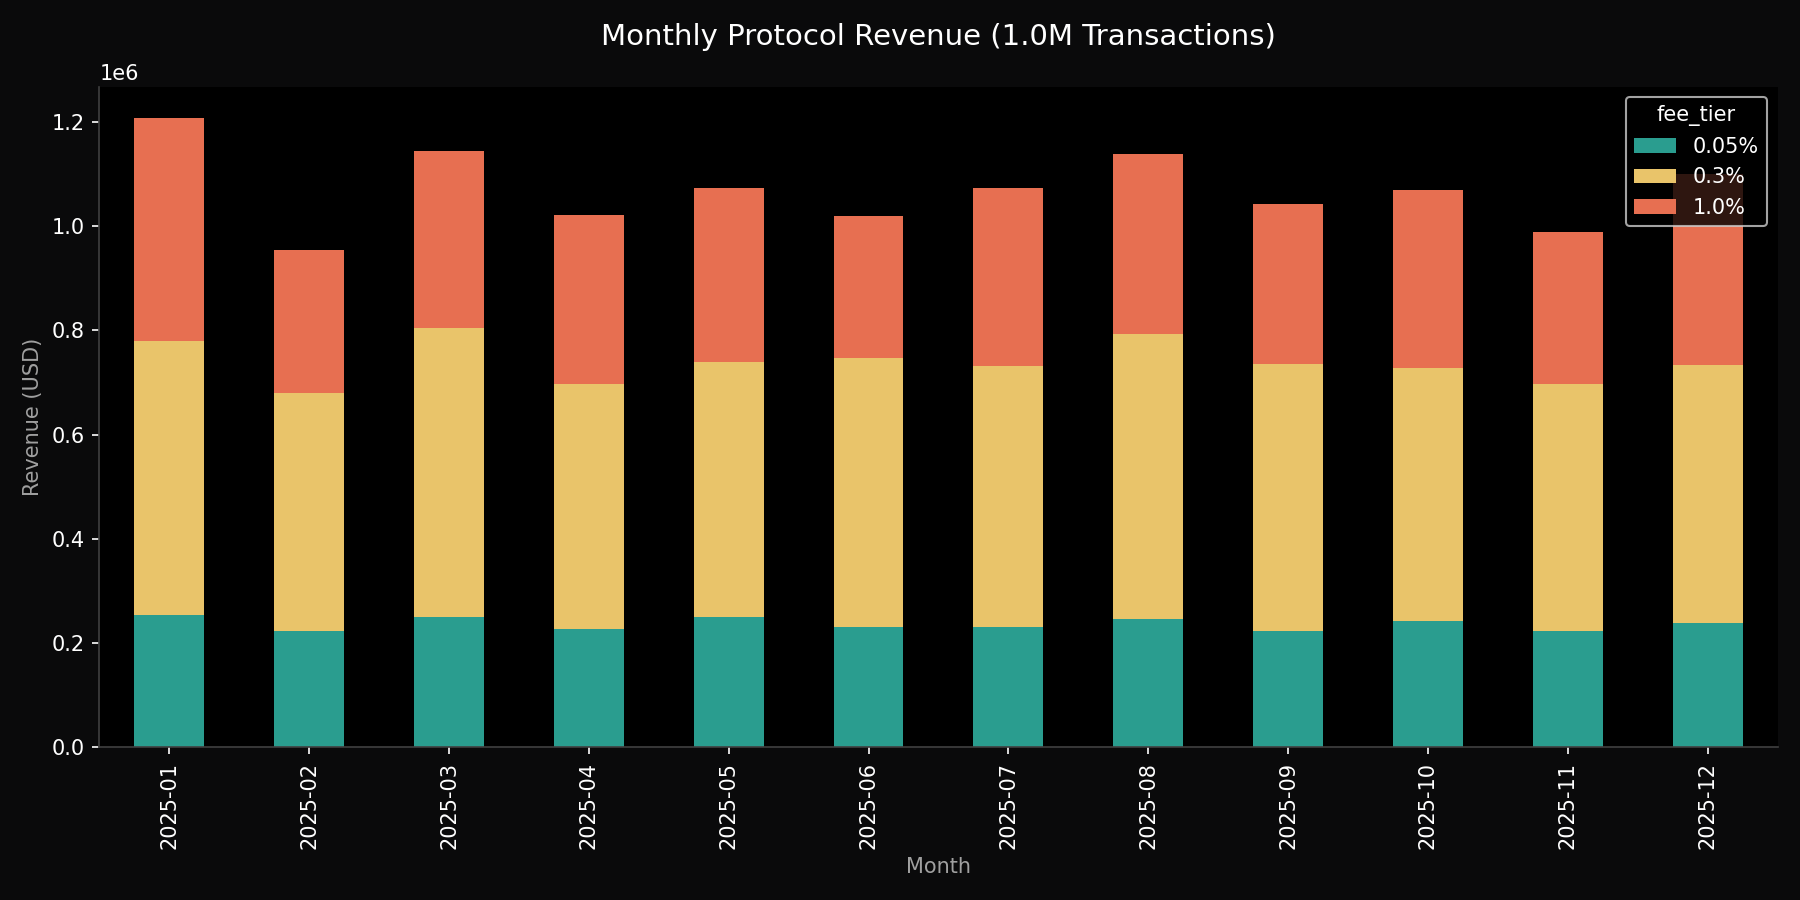 Fig 2: Protocol Revenue processed from 1M+ rows.